As my internet line bandwidth is terrible every day during „prime time“ (about between 8pm and 11pm) I wanted to create a small test to have a proof to show to my ISP as well as to find out the critical hours.
As my ISP always tells me to test with a specific speed test (actually it resides on a web page owned by the provider, giving a small distance in hops), I started analyzing what the speed test really does.
The page is http://speedtest-1.unitymedia.de/
As it turns out, the speed test is a flash application. When analyzing the network traffic you quickly find out that the speed test basically does nothing more than downloading a huge 4000 x 4000 pixels random jpg file and then measuring the time it took to download it:
http://speedtest-1.unitymedia.de/speedtest/random4000x4000.jpg?x=randomnumber
The address is called with a parameter called ‚x‘ which is randomized at every new test.
Knowing how to do it, I fired up Notepad++ and created a small script in node.js that repeats this test every two minutes and dumps the result in a syslog file that I can feed into my small Splunk instance to be able to graph it:
var syslog = require('./syslog');
var syslog = require('./syslog');
var http = require('http');

var intervalSeconds = 120;

var totalMBit = 0;
var totalBytesPerSec = 0;
var numRunning = 0;

function bpsToMBit(_bps)
{
	return _bps * 8.0 / (1024 * 1024);
}

function testBandwidthMultiple()
{
	if( numRunning > 0 )
		return;

	totalMBit = 0;

	for( var i=0; i<6; ++i )
	{
		++numRunning;
		testBandwidth();
	}
}
function testBandwidth()
{
//	var url = 'http://speedtest-1.unitymedia.de/speedtest/random4000x4000.jpg';
	var url = 'xxxxx';

	url = url + "?x=" + (Math.random() * 100000.0 + 10000.0);

	var size = 0;

	var t0 = 0;
	var t1 = 0;

	console.log( "Connecting to " + url );

	var request = http.get(url, function(res)
	{
		res.setEncoding('binary')
//		console.log('HEADERS: ' + JSON.stringify(res.headers));

		res.on('end', function()
		{
			var dt = t1 - t0;

			var bytesPerSec = size / dt * 1000.0;

			var mbit = bpsToMBit(bytesPerSec);

			totalMBit += mbit;
			totalBytesPerSec += bytesPerSec;

			--numRunning;

			console.log( "size " + size + ", bytes per sec " + bytesPerSec + ", mbit " + mbit + ", " + numRunning + " parts left" );

			if( numRunning == 0 )
			{
				console.log( "finished, size " + size + ", total bytes per sec " + totalBytesPerSec  + ", total mbit " + totalMBit );

				syslog.log( "BANDWIDTH"	, "isp", "Unitymedia"
										, "mbit", totalMBit
										, "bytespersec", totalBytesPerSec
										, "size", size );
			}
		})

		res.on('data', function(data)
		{
			var tCurrent = Date.now();

			if( t0 == 0 )
			{
				t0 = tCurrent;
			}
			else
			{
				size += data.length;
			}

			t1 = tCurrent;
		})

		res.on('error', function(e)
		{
			console.log("Error: " + e);
		})
	});
}

testBandwidthMultiple();

setInterval( testBandwidthMultiple, 1000 * intervalSeconds);
So while typing this article, the test is now running since some minutes and the first graph can be shown:
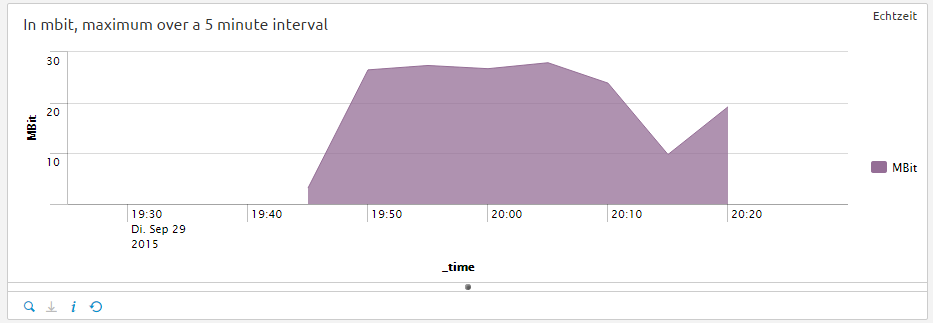
Given the fact that I pay for a 100 mbit line, this is terrible. Of course, I’ll post a longer graph tomorrow when the script has been run for a longer time.
Update October 1st, 2015:
So as promised, here is a graph for the last 24 hours:
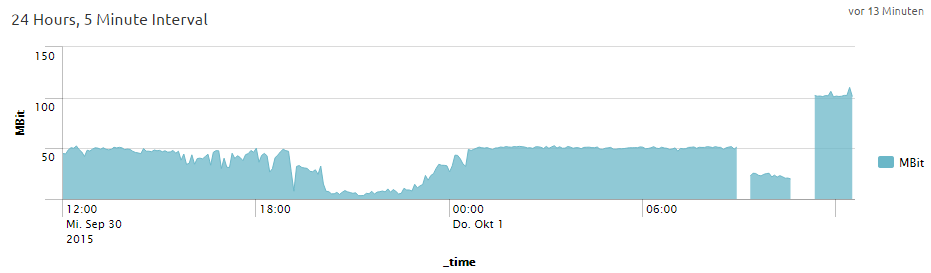
As you can see, there is a huge bandwidth drop starting at about 6pm, lasting until about 1am. This also happend one day before.
Additionally, you can see that I never managed to get above 50MBit and I was starting to hunt for a bug in my code but didn’t find one. I modified the code now to use five connections at once (code snipped above is updated), but still there was no large increase. Then suddently the speed test from Unitymedia went down and I was no longer able to test it further so I had to find a new host where I can download test data from.
At first, I tried my small V-Server but as you can see, it couldn’t provide enough bandwidth. But after that, finally I’ve found a new host so the tests can continue. As you can see, I finally reach the promised 100 Mbits so this evening will be the first day where you can see the full bandwidth drop. The next image will be posted tomorrow.
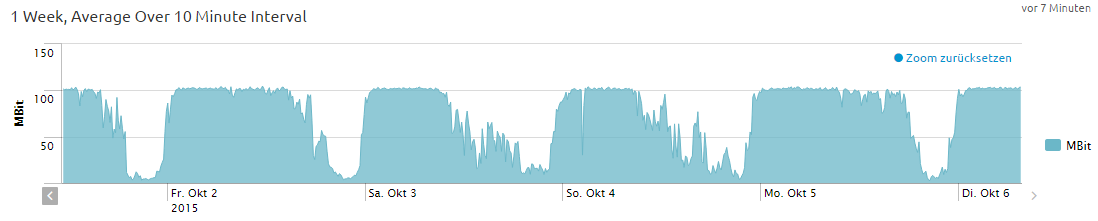
Update October 6th, 2015:
Sorry for being late, but here are the new graphs:

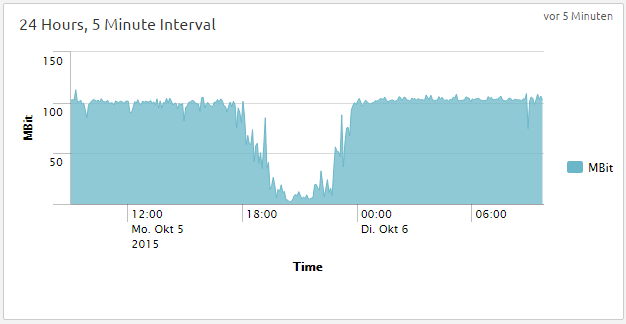
As you can see, the problem gets worse on weekends. So far, a Unitymedia guy will be here on Wednesday to check my line. Doesn’t make much sense in my case because the SNR levels on the modem look okay, but anyway he will be there.